Array
(
[_wp_page_template] => Array
(
[0] => default
)
[_yoast_indexnow_last_ping] => Array
(
[0] => 1728623097
)
[_download_short_title] => Array
(
[0] => field_5cef892461912
)
[download_short_title] => Array
(
[0] => China Health Supplements Market Data Pack - January 2024
)
[_download_intro] => Array
(
[0] => field_64ef2d5b76486
)
[download_intro] => Array
(
[0] => Each month, TMO Group compiles data from Alibaba's family of eCommerce platforms (including Taobao, Tmall, Tmall Global, and Tmall Supermarket) regarding sales of health supplements both domestically and across borders. This data is presented in a form that's easier for English-speaking overseas companies and individuals to approach, with an array of charts and tables as well as translated terms.
)
[_download_preview_file] => Array
(
[0] => field_64edce2ff2e06
)
[download_preview_file] => Array
(
[0] =>
)
[_download_features] => Array
(
[0] => field_64edcc9a983cc
)
[download_features] => Array
(
[0] =>
)
[_download_related] => Array
(
[0] => field_5b39a37f8493b
)
[download_related] => Array
(
[0] =>
)
[_free_vs_premium] => Array
(
[0] => field_65b18a992edc6
)
[free_vs_premium] => Array
(
[0] =>
)
[_table_of_contents] => Array
(
[0] => field_65b18cc85d2c7
)
[table_of_contents] => Array
(
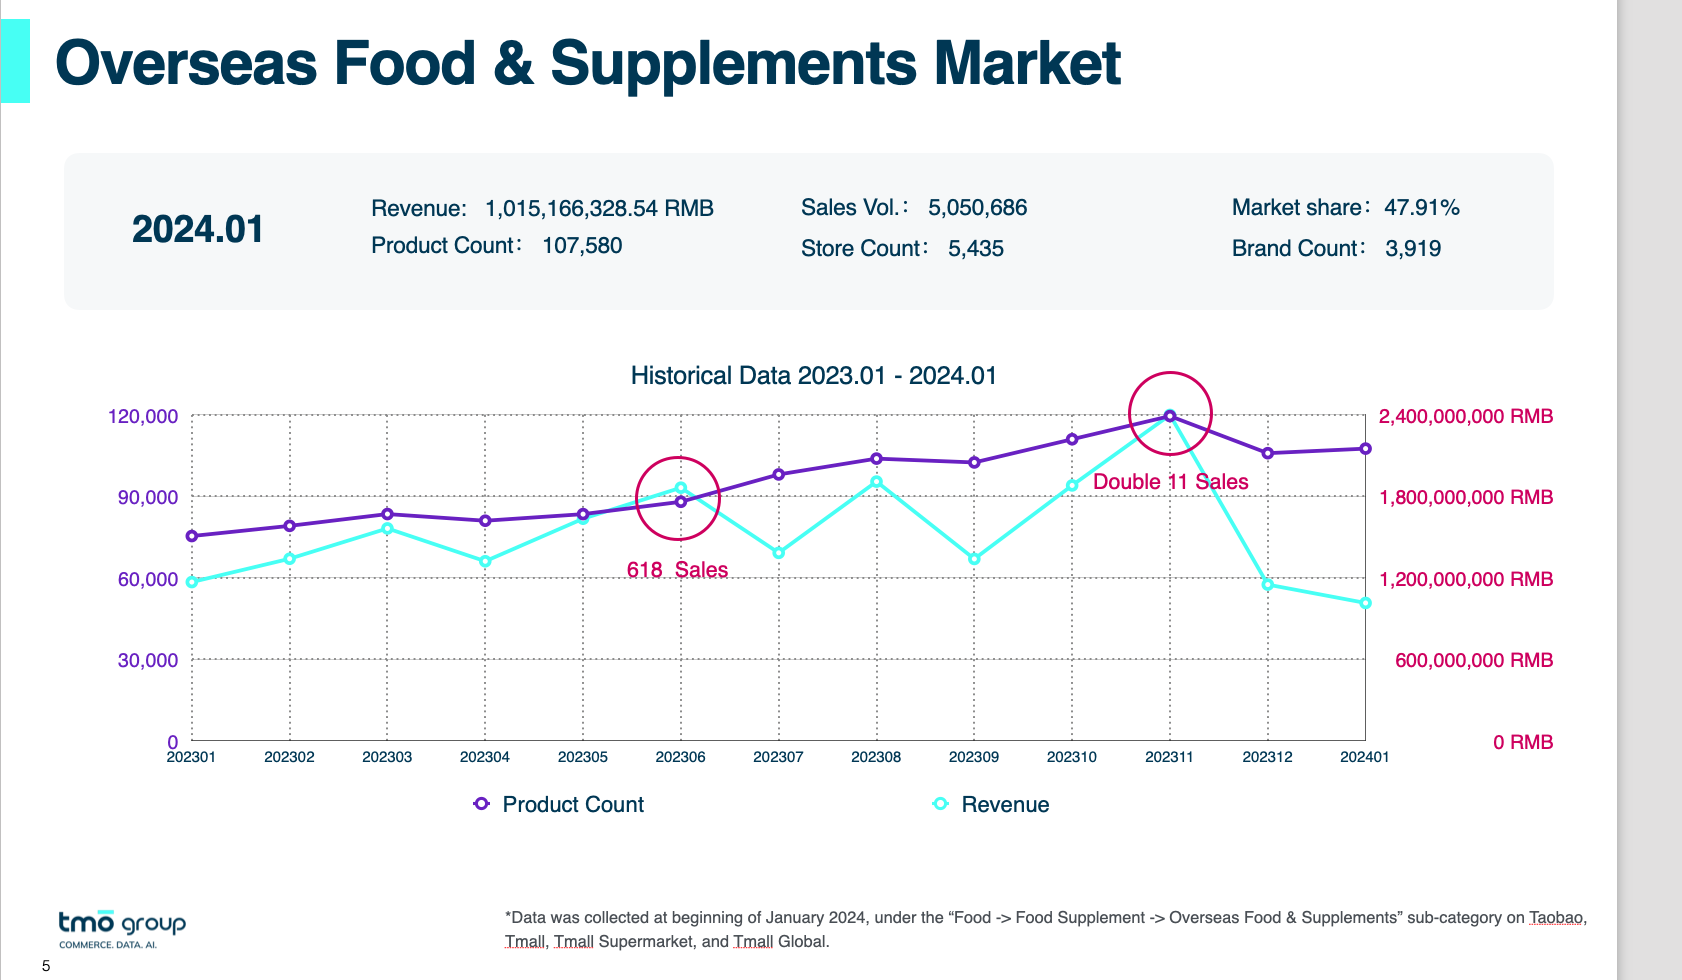
[0] => As the first month after “Double Eleven” and “Double Twelve” promotions, the monthly sales performance of overseas health supplements on Alibaba’s platform in January 2024 experienced a slight decline, amounting to a total revenue of approximately 1.015 billion. While there has been no immediate sales rebound at the start of the new year, there has been an increase in the number of brands, stores and products. Data indicates an 8.92% month-on-month increase in the number of brands on e-commerce platforms, along with an 8.75% month-on-month increase in the number of stores. This may suggest a continued rise in demand for online health consumption.
Early February marks the Chinese Lunar New Year, a time people prefer to purchase meaningful goods and gifts for their relatives and friends. According to statistics, the number of collections and comments on overseas health supplements in January showed a significant increase compared to December 2023, which reflected that consumers tend to pay more attention to health-related products. Swisse from Australia, GNC from the USA, as well as Blackmores from Australia ranked among the top 3 in monthly sales for overseas brands in January 2024. This data pack includes:
- Analysis of the month’s trends and biggest winners
- The month’s best-selling products
- Sub-category market share
- Market share by price range
- Most popular brands
- Brand price distribution
- Best-selling product characteristics
- Detailed sub-category market information
)
[_highlight] => Array
(
[0] => field_65b18d3a62844
)
[highlight] => Array
(
[0] =>
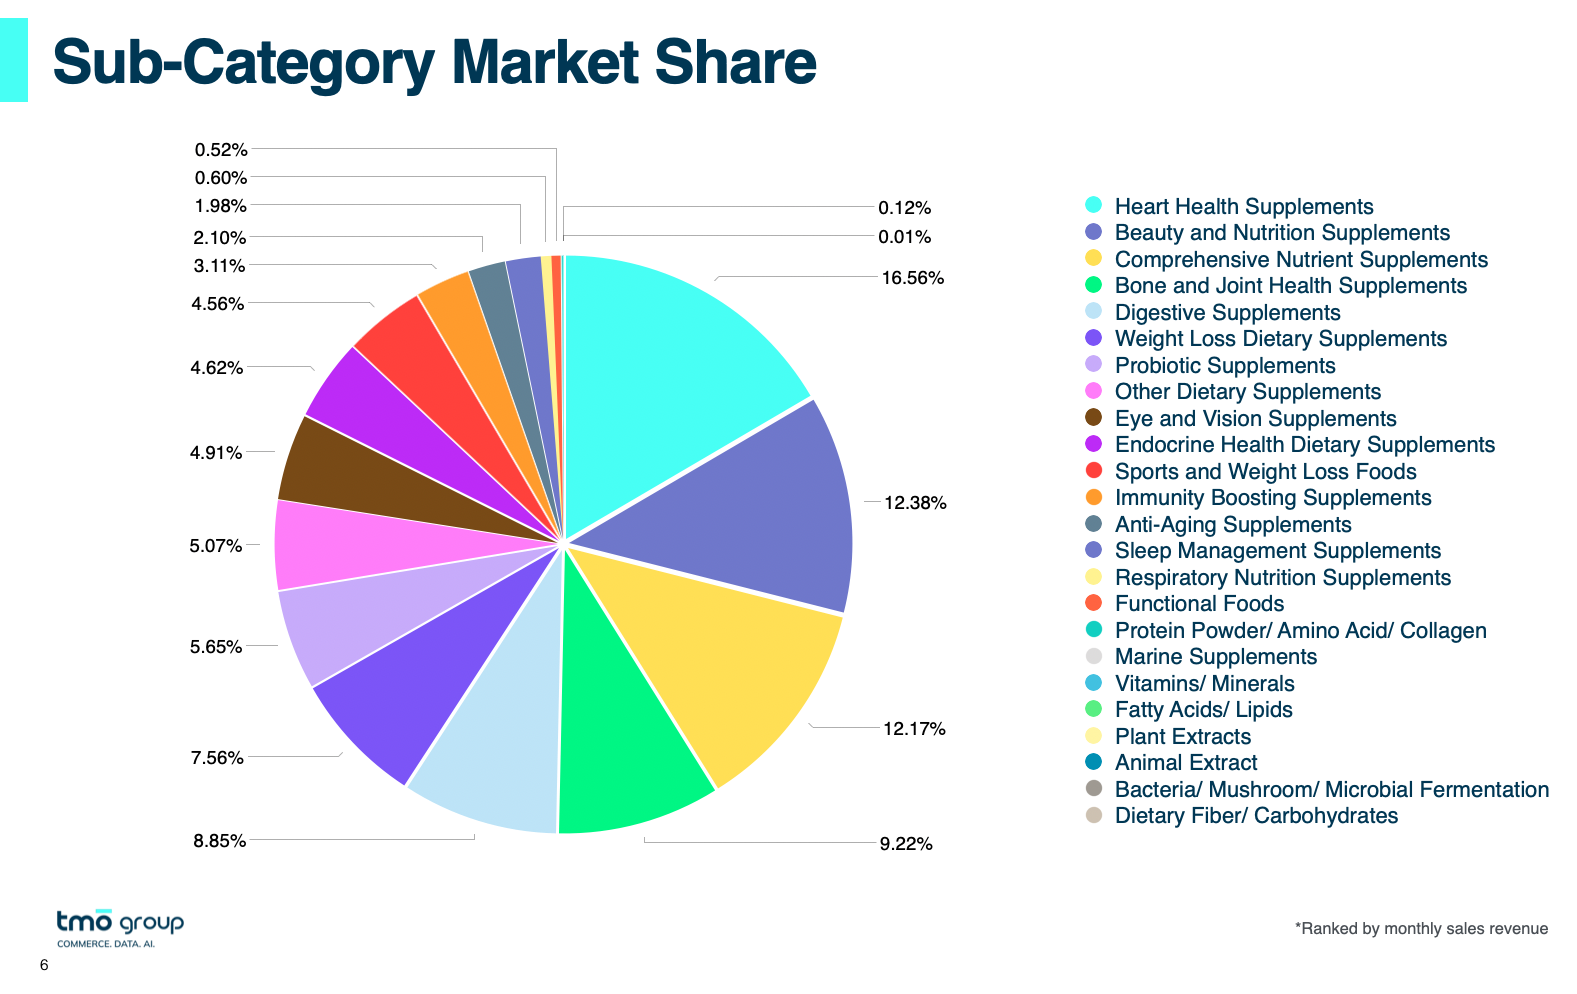
- In terms of subcategories, overseas heart health supplements led the overseas health supplement market with a market share of 16.56% in January 2024. Before the Spring Festival, the popularity of overseas beauty and nutrition supplements increased, ranking second with a market share of 12.38%, surpassing the comprehensive nutrient supplements that ranked second in December last year.
- Regarding brands performance, Swisse became the champion of monthly sales in 2024, with sales exceeding the second-place GNC by twice, and Blackmores ranked third. Australia’s Life Space had an excellent sales performance in January 2024, jumping from tenth place in December last year to fifth place this year.
- In terms of products, thistle products are the best-selling items in January 2024. Swisse’s high-concentration milk thistle liver protection tablets won the championship in the sales rank. This product helps consumers relieve digestive burden, purify the liver, as well as reduce intestinal discomfort, making it very effective for people who work long hours and stay up late. Apart from this product, Swisse’s other liver protection product is also among the top-selling products, reflecting that domestic consumers pay significant attention to liver health. In addition, health products that are beneficial to the physical nutrition of cancer patients have also received high attention. For example, Nestle Health Science’s white blood cell boosting product achieved sales revenue of around 4.18 million in January, ranking fourth in the product sales list. In the list of soaring products, Healrejuve’s soy isoflavone health products became the champion of the list. This product helps women regulate their menstrual cycles and nourish the ovaries.
)
[_highlight_gallery] => Array
(
[0] => field_65b18d6f62845
)
[highlight_gallery] => Array
(
[0] => a:2:{i:0;s:5:"86026";i:1;s:5:"86028";}
)
[_highlight_popup] => Array
(
[0] => field_65b18d7f62846
)
[highlight_popup] => Array
(
[0] => 1
)
[_button_link] => Array
(
[0] => field_65de8afb998f5
)
[button_link] => Array
(
[0] =>
)
[_related_downloads] => Array
(
[0] => field_65b18dfcc580d
)
[related_downloads] => Array
(
[0] =>
)
[_banner_link_1] => Array
(
[0] => field_65b18eda3aab7
)
[banner_link_1] => Array
(
[0] => /contact/
)
[_banner_link_2] => Array
(
[0] => field_65b18f013aab8
)
[banner_link_2] => Array
(
[0] =>
)
[_qa] => Array
(
[0] => field_65b18f2c3aabb
)
[_qa_0_question] => Array
(
[0] => field_65b18f3b3aabc
)
[qa_0_question] => Array
(
[0] => Which payment methods are currently available to purchase a resource?
)
[_qa_0_answer] => Array
(
[0] => field_65b18f433aabd
)
[qa_0_answer] => Array
(
[0] => At the moment we only support credit card payments. However, in the near future this will be expanded to include other popular methods such as WeChat Pay and Alipay.
)
[_qa_1_question] => Array
(
[0] => field_65b18f3b3aabc
)
[qa_1_question] => Array
(
[0] => What should I do if I have not received my email or my payment failed?
)
[_qa_1_answer] => Array
(
[0] => field_65b18f433aabd
)
[qa_1_answer] => Array
(
[0] => If you encounter any problems throughout the ordering process, get in touch with us. You can reach us through our online customer service. Alternatively, you can send an email to info@tmogroup.asia or give us a call at +86 (0)21 617 00 396.
)
[_qa_2_question] => Array
(
[0] => field_65b18f3b3aabc
)
[qa_2_question] => Array
(
[0] => If my payment was successful, can I receive an invoice?
)
[_qa_2_answer] => Array
(
[0] => field_65b18f433aabd
)
[qa_2_answer] => Array
(
[0] => TMO Group can provide an invoice for purchase of the guides. If you need an invoice, please send a request by email to info@tmogroup.asia with the detailed company information for the invoice and the payment receipt. Once we receive, we can issue the digital invoice and send it to you via e-mail within 10 working days.
)
[qa] => Array
(
[0] => 4
)
[_free_download] => Array
(
[0] => field_65c434b88abef
)
[free_download] => Array
(
[0] =>
)
[_companies] => Array
(
[0] => field_65e5bd0a33aac
)
[companies] => Array
(
[0] => a:16:{i:0;s:5:"87064";i:1;s:5:"87067";i:2;s:5:"87071";i:3;s:5:"87074";i:4;s:5:"87070";i:5;s:5:"87078";i:6;s:5:"87076";i:7;s:5:"87075";i:8;s:5:"87077";i:9;s:5:"87072";i:10;s:5:"87079";i:11;s:5:"87101";i:12;s:5:"87102";i:13;s:5:"87065";i:14;s:5:"87073";i:15;s:5:"87068";}
)
[_yoast_wpseo_focuskw_text_input] => Array
(
[0] =>
)
[_edd_download_earnings] => Array
(
[0] => 0.000000
)
[_edd_download_sales] => Array
(
[0] => 58
)
[onesignal_meta_box_present] => Array
(
[0] => 1
)
[onesignal_send_notification] => Array
(
[0] =>
)
[onesignal_modify_title_and_content] => Array
(
[0] =>
)
[onesignal_notification_custom_heading] => Array
(
[0] =>
)
[onesignal_notification_custom_content] => Array
(
[0] =>
)
[_yoast_wpseo_focuskeywords] => Array
(
[0] => [{"keyword":"China food supplements data","score":39},{"keyword":"dietary supplements data","score":39}]
)
[_yoast_wpseo_keywordsynonyms] => Array
(
[0] => ["Health supplements data June 18th, health supplements data 6.18, health supplements data 6-18, Health supplements data june","",""]
)
[_yoast_wpseo_estimated-reading-time-minutes] => Array
(
[0] => 1
)
[_yoast_wpseo_wordproof_timestamp] => Array
(
[0] =>
)
[edd_price] => Array
(
[0] => 0.00
)
[edd_download_files] => Array
(
[0] => a:1:{i:2;a:6:{s:5:"index";s:0:"";s:13:"attachment_id";s:1:"0";s:14:"thumbnail_size";s:5:"false";s:4:"name";s:47:"TMO Health Supplements Data Pack 202401 EN FREE";s:4:"file";s:108:"https://www.tmogroup.asia/wp-content/uploads/edd/2024/03/TMO-Health-Supplements-Data-Pack-202401-EN-FREE.pdf";s:9:"condition";s:3:"all";}}
)
[_edd_bundled_products] => Array
(
[0] => a:1:{i:0;s:1:"0";}
)
[_edd_button_behavior] => Array
(
[0] => add_to_cart
)
[download_intro_content_title] => Array
(
[0] => China Health Supplements Market Data Pack - January 2024
)
[_download_intro_content_title] => Array
(
[0] => field_5cef892461912
)
[download_intro_content] => Array
(
[0] => Each month, TMO Group compiles data from Alibaba's family of eCommerce platforms (including Taobao, Tmall, Tmall Global, and Tmall Supermarket) regarding sales of health supplements both domestically and across borders. This data is presented in a form that's easier for English-speaking overseas companies and individuals to approach, with an array of charts and tables as well as translated terms.
)
[_download_intro_content] => Array
(
[0] => field_5b39a9e1352d2
)
[related_section_title] => Array
(
[0] => Others Also Looked at These...
)
[_related_section_title] => Array
(
[0] => field_5b3adde339f9b
)
[related_section_related_downloads_0_download] => Array
(
[0] => 38077
)
[_related_section_related_downloads_0_download] => Array
(
[0] => field_5b39a37f8493b
)
[related_section_related_downloads] => Array
(
[0] => 3
)
[_related_section_related_downloads] => Array
(
[0] => field_5b39a3138493a
)
[_edd_all_access_enabled] => Array
(
[0] =>
)
[_edd_all_access_settings] => Array
(
[0] =>
)
[_edd_all_access_receipt_settings] => Array
(
[0] =>
)
[_wp_old_date] => Array
(
[0] => 20/06/2022
[1] => 2024-03-21
)
[tmo_post_views_count] => Array
(
[0] => 9236
)
[inline_featured_image] => Array
(
[0] => 0
)
[otw_grid_manager_content] => Array
(
[0] => []
)
[_yoast_wpseo_focuskw] => Array
(
[0] => Health supplements data,China health supplements,anti-radiation,nuclear radiation,selenium ,heart health,whitening pills
)
[_yoast_wpseo_title] => Array
(
[0] => China Health Supplements Market Data Pack - January 2024 FREE
)
[_yoast_wpseo_metadesc] => Array
(
[0] => This data pack is the December 2023 edition free version. It covers market data, trends, and changes in consumer demand in the China Health Supplement market for December 2023.
)
[_yoast_wpseo_linkdex] => Array
(
[0] => 28
)
[download_description_0_title] => Array
(
[0] =>
)
[_download_description_0_title] => Array
(
[0] => field_5b399a5d21e4c
)
[download_description_0_content] => Array
(
[0] =>
As the first month after “Double Eleven'' and “Double Twelve” promotions, the monthly sales performance of overseas health supplements on Alibaba’s platform in January 2024 experienced a slight decline, amounting to a total revenue of approximately 1.015 billion. While there has been no immediate sales rebound at the start of the new year, there has been an increase in the number of brands, stores and products. Data indicates an 8.92% month-on-month increase in the number of brands on e-commerce platforms, along with an 8.75% month-on-month increase in the number of stores. This may suggest a continued rise in demand for online health consumption.
Early February marks the Chinese Lunar New Year, a time people prefer to purchase meaningful goods and gifts for their relatives and friends. According to statistics, the number of collections and comments on overseas health supplements in January showed a significant increase compared to December 2023, which reflected that consumers tend to pay more attention to health-related products. Swisse from Australia, GNC from the USA, as well as Blackmores from Australia ranked among the top 3 in monthly sales for overseas brands in January 2024.
)
[_download_description_0_content] => Array
(
[0] => field_5b399a6b21e4d
)
[download_description_1_title] => Array
(
[0] =>
)
[_download_description_1_title] => Array
(
[0] =>
)
[download_description_1_content] => Array
(
[0] =>
)
[_download_description_1_content] => Array
(
[0] =>
)
[download_description_2_title] => Array
(
[0] => January 2024 Highlights
)
[_download_description_2_title] => Array
(
[0] => field_5b399a5d21e4c
)
[download_description_2_content] => Array
(
[0] =>
- In terms of subcategories, overseas heart health supplements led the overseas health supplement market with a market share of 16.56% in January 2024. Before the Spring Festival, the popularity of overseas beauty and nutrition supplements increased, ranking second with a market share of 12.38%, surpassing the comprehensive nutrient supplements that ranked second in December last year.
- Regarding brands performance, Swisse became the champion of monthly sales in 2024, with sales exceeding the second-place GNC by twice, and Blackmores ranked third. Australia's Life Space had an excellent sales performance in January 2024, jumping from tenth place in December last year to fifth place this year.
- In terms of products, thistle products are the best-selling items in January 2024. Swisse's high-concentration milk thistle liver protection tablets won the championship in the sales rank. This product helps consumers relieve digestive burden, purify the liver, as well as reduce intestinal discomfort, making it very effective for people who work long hours and stay up late. Apart from this product, Swisse's other liver protection product is also among the top-selling products, reflecting that domestic consumers pay significant attention to liver health. In addition, health products that are beneficial to the physical nutrition of cancer patients have also received high attention. For example, Nestle Health Science's white blood cell boosting product achieved sales revenue of around 4.18 million in January, ranking fourth in the product sales list. In the list of soaring products, Healrejuve's soy isoflavone health products became the champion of the list. This product helps women regulate their menstrual cycles and nourish the ovaries.
)
[_download_description_2_content] => Array
(
[0] => field_5b399a6b21e4d
)
[related_section_related_downloads_1_download] => Array
(
[0] => 80755
)
[_related_section_related_downloads_1_download] => Array
(
[0] => field_5b39a37f8493b
)
[related_section_related_downloads_2_download] => Array
(
[0] => 78925
)
[_related_section_related_downloads_2_download] => Array
(
[0] => field_5b39a37f8493b
)
[_yoast_wpseo_primary_download_category] => Array
(
[0] => 154
)
[_edd_download_limit_override_41775] => Array
(
[0] => 4
)
[_wp_old_slug] => Array
(
[0] => china-health-supplements-market-data-pack-june-2021-2|china-health-supplements-market-data-pack-march-april-2023-en-free|https-www-tmogroup-asia-post_typedownloadp78925previewtrue|china-health-supplements-market-data-pack-november-2023-2|china-health-supplements-market-data-pack-january-2024-01
)
[_dp_original] => Array
(
[0] => 78925
)
[download_description_3_title] => Array
(
[0] =>
)
[_download_description_3_title] => Array
(
[0] => field_5b399a5d21e4c
)
[download_description_3_content] => Array
(
[0] => Please download the report for free and find comprehensive information on product price ranges, popular product characteristics, top 10 cross-border stores, and more!
)
[_download_description_3_content] => Array
(
[0] => field_5b399a6b21e4d
)
[download_description_4_image_row_0_image] => Array
(
[0] =>
)
[_download_description_4_image_row_0_image] => Array
(
[0] =>
)
[download_description_4_image_row_0_lightbox] => Array
(
[0] =>
)
[_download_description_4_image_row_0_lightbox] => Array
(
[0] =>
)
[download_description_4_image_row_0_gallery] => Array
(
[0] =>
)
[_download_description_4_image_row_0_gallery] => Array
(
[0] =>
)
[download_description_4_image_row_0_row_id] => Array
(
[0] =>
)
[_download_description_4_image_row_0_row_id] => Array
(
[0] =>
)
[download_description_4_image_row_1_image] => Array
(
[0] =>
)
[_download_description_4_image_row_1_image] => Array
(
[0] =>
)
[download_description_4_image_row_1_lightbox] => Array
(
[0] =>
)
[_download_description_4_image_row_1_lightbox] => Array
(
[0] =>
)
[download_description_4_image_row_1_gallery] => Array
(
[0] =>
)
[_download_description_4_image_row_1_gallery] => Array
(
[0] =>
)
[download_description_4_image_row_1_row_id] => Array
(
[0] =>
)
[_download_description_4_image_row_1_row_id] => Array
(
[0] =>
)
[download_description_4_image_row] => Array
(
[0] =>
)
[_download_description_4_image_row] => Array
(
[0] =>
)
[download_description_4_title] => Array
(
[0] =>
)
[_download_description_4_title] => Array
(
[0] =>
)
[download_description_4_content] => Array
(
[0] =>
)
[_download_description_4_content] => Array
(
[0] =>
)
[download_description_6_image_row_0_image] => Array
(
[0] =>
)
[_download_description_6_image_row_0_image] => Array
(
[0] =>
)
[download_description_6_image_row_0_lightbox] => Array
(
[0] =>
)
[_download_description_6_image_row_0_lightbox] => Array
(
[0] =>
)
[download_description_6_image_row_0_gallery] => Array
(
[0] =>
)
[_download_description_6_image_row_0_gallery] => Array
(
[0] =>
)
[download_description_6_image_row_0_row_id] => Array
(
[0] =>
)
[_download_description_6_image_row_0_row_id] => Array
(
[0] =>
)
[download_description_6_image_row_1_image] => Array
(
[0] =>
)
[_download_description_6_image_row_1_image] => Array
(
[0] =>
)
[download_description_6_image_row_1_lightbox] => Array
(
[0] =>
)
[_download_description_6_image_row_1_lightbox] => Array
(
[0] =>
)
[download_description_6_image_row_1_gallery] => Array
(
[0] =>
)
[_download_description_6_image_row_1_gallery] => Array
(
[0] =>
)
[download_description_6_image_row_1_row_id] => Array
(
[0] =>
)
[_download_description_6_image_row_1_row_id] => Array
(
[0] =>
)
[download_description_6_image_row] => Array
(
[0] =>
)
[_download_description_6_image_row] => Array
(
[0] =>
)
[download_description_2_image_row_0_image] => Array
(
[0] =>
)
[_download_description_2_image_row_0_image] => Array
(
[0] =>
)
[download_description_2_image_row_0_lightbox] => Array
(
[0] =>
)
[_download_description_2_image_row_0_lightbox] => Array
(
[0] =>
)
[download_description_2_image_row_0_gallery] => Array
(
[0] =>
)
[_download_description_2_image_row_0_gallery] => Array
(
[0] =>
)
[download_description_2_image_row_0_row_id] => Array
(
[0] =>
)
[_download_description_2_image_row_0_row_id] => Array
(
[0] =>
)
[download_description_2_image_row_1_image] => Array
(
[0] =>
)
[_download_description_2_image_row_1_image] => Array
(
[0] =>
)
[download_description_2_image_row_1_lightbox] => Array
(
[0] =>
)
[_download_description_2_image_row_1_lightbox] => Array
(
[0] =>
)
[download_description_2_image_row_1_gallery] => Array
(
[0] =>
)
[_download_description_2_image_row_1_gallery] => Array
(
[0] =>
)
[download_description_2_image_row_1_row_id] => Array
(
[0] =>
)
[_download_description_2_image_row_1_row_id] => Array
(
[0] =>
)
[download_description_2_image_row] => Array
(
[0] =>
)
[_download_description_2_image_row] => Array
(
[0] =>
)
[download_description_5_title] => Array
(
[0] => This data pack includes:
)
[_download_description_5_title] => Array
(
[0] => field_5b399a5d21e4c
)
[download_description_5_content] => Array
(
[0] =>
- Analysis of the month's trends and biggest winners
- The month's best-selling products
- Sub-category market share
- Market share by price range
- Most popular brands
- Brand price distribution
- Best-selling product characteristics
)
[_download_description_5_content] => Array
(
[0] => field_5b399a6b21e4d
)
[download_description_8_title] => Array
(
[0] =>
)
[_download_description_8_title] => Array
(
[0] =>
)
[download_description_8_content] => Array
(
[0] =>
)
[_download_description_8_content] => Array
(
[0] =>
)
[download_description_9_title] => Array
(
[0] =>
)
[_download_description_9_title] => Array
(
[0] =>
)
[download_description_9_content] => Array
(
[0] =>
)
[_download_description_9_content] => Array
(
[0] =>
)
[download_description_3_image_row_0_image] => Array
(
[0] =>
)
[_download_description_3_image_row_0_image] => Array
(
[0] =>
)
[download_description_3_image_row_0_lightbox] => Array
(
[0] =>
)
[_download_description_3_image_row_0_lightbox] => Array
(
[0] =>
)
[download_description_3_image_row_0_gallery] => Array
(
[0] =>
)
[_download_description_3_image_row_0_gallery] => Array
(
[0] =>
)
[download_description_3_image_row_0_row_id] => Array
(
[0] =>
)
[_download_description_3_image_row_0_row_id] => Array
(
[0] =>
)
[download_description_3_image_row_1_image] => Array
(
[0] =>
)
[_download_description_3_image_row_1_image] => Array
(
[0] =>
)
[download_description_3_image_row_1_lightbox] => Array
(
[0] =>
)
[_download_description_3_image_row_1_lightbox] => Array
(
[0] =>
)
[download_description_3_image_row_1_gallery] => Array
(
[0] =>
)
[_download_description_3_image_row_1_gallery] => Array
(
[0] =>
)
[download_description_3_image_row_1_row_id] => Array
(
[0] =>
)
[_download_description_3_image_row_1_row_id] => Array
(
[0] =>
)
[download_description_3_image_row] => Array
(
[0] =>
)
[_download_description_3_image_row] => Array
(
[0] =>
)
[download_description_6_title] => Array
(
[0] => Who are these data packs intended for?
)
[_download_description_6_title] => Array
(
[0] => field_5b399a5d21e4c
)
[download_description_6_content] => Array
(
[0] => These data packs are designed to assist researchers, data analysts, product development professionals, business decision makers, and anyone involved in strategic planning at overseas health supplements companies, or entities and individuals interested in this area. By keeping up with each month's shifts in sales and consumer behavior, such experts can get a more firm grip on the trends and shifting attitudes in China's growing and increasingly competitive health supplements market.
For more information, download this month's data pack today!
As well as our monthly data packs, we also put together a comprehensive guide to the health supplements industry in China, updated annually and available absolutely free right here.
)
[_download_description_6_content] => Array
(
[0] => field_5b399a6b21e4d
)
[download_description_5_image_row_0_image] => Array
(
[0] =>
)
[_download_description_5_image_row_0_image] => Array
(
[0] =>
)
[download_description_5_image_row_0_lightbox] => Array
(
[0] =>
)
[_download_description_5_image_row_0_lightbox] => Array
(
[0] =>
)
[download_description_5_image_row_0_gallery] => Array
(
[0] =>
)
[_download_description_5_image_row_0_gallery] => Array
(
[0] =>
)
[download_description_5_image_row_0_row_id] => Array
(
[0] =>
)
[_download_description_5_image_row_0_row_id] => Array
(
[0] =>
)
[download_description_5_image_row_1_image] => Array
(
[0] =>
)
[_download_description_5_image_row_1_image] => Array
(
[0] =>
)
[download_description_5_image_row_1_lightbox] => Array
(
[0] =>
)
[_download_description_5_image_row_1_lightbox] => Array
(
[0] =>
)
[download_description_5_image_row] => Array
(
[0] =>
)
[_download_description_5_image_row] => Array
(
[0] =>
)
[download_description_7_title] => Array
(
[0] => Data upgrade notification:
)
[_download_description_7_title] => Array
(
[0] => field_5b399a5d21e4c
)
[download_description_7_content] => Array
(
[0] =>
Starting from the April 2023 monthly Datapack, TMO has optimized and adjusted the data collection methods used in the reports to provide readers with improved content. Readers will observe that the sales data in the data packs reflect a decrease compared to previous packs, albeit with the overall market landscape remaining unchanged. This is due to the enhanced accuracy of data collection, which improves the aggregation results in the following areas:
- Store Count: The store count is calculated based on actual sales-generating stores, excluding inactive or non-performing stores from the calculation.
- Product Count: The product count is determined by considering actual sales-generating products measured in terms of Standard Product Units (SPUs), excluding products that have not contributed to sales during the specified period.
- Sales Volume: The sales volume data has been refined by removing anomalous data points such as fake orders, while also excluding returns and refunds. This ensures that the monthly sales volume reflects a more accurate representation of the actual market situation.
- Sales Revenue: Due to adjustments in the calculation methodology for product count and sales volume, the monthly sales revenue data has noticeably decreased. TMO removes anomalous data points like fake orders and returns/refunds, resulting in more accurate sales revenue figures.
*Explanation of data deviations:
Although we utilize our own sophisticated and comprehensive algorithmic models for data analysis, it is important to note that there may still be some data deviations due to the nature of data collection and calculation dimensions. Here are a few factors that contribute to these deviations:
- Overall Collection Dimension: There may be instances where some stores are not yet included in the data collection process, resulting in partial store coverage.
- Accuracy of Sales Volume Dimension: Rapid delisting of certain products can result in missing relevant data, causing the sales volume to be slightly lower than the actual figures. Additionally, updates to public page data may introduce some delay, resulting in temporal discrepancies in the sales volume.
- Accuracy of Sales Revenue Dimension: Some information, such as store-specific member coupons or platform-wide discounts, may not be accessible through public pages. The calculation of prices for multiple SKUs related to promotional coupons can introduce variations, leading to deviations in the accuracy of sales revenue calculations.
Overall data accuracy ranges from 80% to 95%, with some brands or stores exhibiting larger variances.
Readers are advised to approach the data with caution and use it as a reference rather than an absolute measure.
)
[_download_description_7_content] => Array
(
[0] => field_5b399a6b21e4d
)
[download_description_7_image_row_0_image] => Array
(
[0] =>
)
[_download_description_7_image_row_0_image] => Array
(
[0] =>
)
[download_description_7_image_row_0_lightbox] => Array
(
[0] =>
)
[_download_description_7_image_row_0_lightbox] => Array
(
[0] =>
)
[download_description_7_image_row_0_gallery] => Array
(
[0] =>
)
[_download_description_7_image_row_0_gallery] => Array
(
[0] =>
)
[download_description_7_image_row_0_row_id] => Array
(
[0] =>
)
[_download_description_7_image_row_0_row_id] => Array
(
[0] =>
)
[download_description_7_image_row_1_image] => Array
(
[0] =>
)
[_download_description_7_image_row_1_image] => Array
(
[0] =>
)
[download_description_7_image_row_1_lightbox] => Array
(
[0] =>
)
[_download_description_7_image_row_1_lightbox] => Array
(
[0] =>
)
[download_description_7_image_row_1_gallery] => Array
(
[0] =>
)
[_download_description_7_image_row_1_gallery] => Array
(
[0] =>
)
[download_description_7_image_row_1_row_id] => Array
(
[0] =>
)
[_download_description_7_image_row_1_row_id] => Array
(
[0] =>
)
[download_description_7_image_row] => Array
(
[0] =>
)
[_download_description_7_image_row] => Array
(
[0] =>
)
[download_description_9_image_row_0_image] => Array
(
[0] =>
)
[_download_description_9_image_row_0_image] => Array
(
[0] =>
)
[download_description_9_image_row_0_lightbox] => Array
(
[0] =>
)
[_download_description_9_image_row_0_lightbox] => Array
(
[0] =>
)
[download_description_9_image_row_0_gallery] => Array
(
[0] =>
)
[_download_description_9_image_row_0_gallery] => Array
(
[0] =>
)
[download_description_9_image_row_0_row_id] => Array
(
[0] =>
)
[_download_description_9_image_row_0_row_id] => Array
(
[0] =>
)
[download_description_9_image_row_1_image] => Array
(
[0] =>
)
[_download_description_9_image_row_1_image] => Array
(
[0] =>
)
[download_description_9_image_row_1_lightbox] => Array
(
[0] =>
)
[_download_description_9_image_row_1_lightbox] => Array
(
[0] =>
)
[download_description_9_image_row_1_gallery] => Array
(
[0] =>
)
[_download_description_9_image_row_1_gallery] => Array
(
[0] =>
)
[download_description_9_image_row_1_row_id] => Array
(
[0] =>
)
[_download_description_9_image_row_1_row_id] => Array
(
[0] =>
)
[download_description_9_image_row] => Array
(
[0] =>
)
[_download_description_9_image_row] => Array
(
[0] =>
)
[_edd_download_limit_override_56532] => Array
(
[0] =>
)
[download_description_5_image_row_1_gallery] => Array
(
[0] =>
)
[_download_description_5_image_row_1_gallery] => Array
(
[0] =>
)
[download_description_5_image_row_1_row_id] => Array
(
[0] =>
)
[_download_description_5_image_row_1_row_id] => Array
(
[0] =>
)
[_yoast_post_redirect_info] => Array
(
[0] => a:4:{s:6:"origin";s:67:"downloads/china-health-supplements-market-data-pack-january-2024-01";s:6:"target";s:64:"downloads/china-health-supplements-market-data-pack-january-2024";s:4:"type";i:301;s:6:"format";s:5:"plain";}
)
[_edd_download_limit_override_63320] => Array
(
[0] =>
)
[_edd_download_limit_override_63318] => Array
(
[0] =>
)
[mmpm_post_icon] => Array
(
[0] =>
)
[_edd_download_limit_override_40494] => Array
(
[0] =>
)
[download_intro_title] => Array
(
[0] =>
)
[_download_intro_title] => Array
(
[0] =>
)
[download_description_1_image_row_0_image] => Array
(
[0] => 80785
)
[_download_description_1_image_row_0_image] => Array
(
[0] => field_5b39a07f6cde0
)
[download_description_1_image_row_1_image] => Array
(
[0] => 80786
)
[_download_description_1_image_row_1_image] => Array
(
[0] => field_5b39a07f6cde0
)
[download_description_1_image_row] => Array
(
[0] => 2
)
[_download_description_1_image_row] => Array
(
[0] => field_5b39a0486cddf
)
[download_description_1_image_row_0_lightbox] => Array
(
[0] => 1
)
[_download_description_1_image_row_0_lightbox] => Array
(
[0] => field_5b5947836e6c1
)
[download_description_1_image_row_0_gallery] => Array
(
[0] => a:1:{i:0;s:5:"80785";}
)
[_download_description_1_image_row_0_gallery] => Array
(
[0] => field_5b5947a86e6c2
)
[download_description_1_image_row_0_row_id] => Array
(
[0] => 649d6e0f4644f
)
[_download_description_1_image_row_0_row_id] => Array
(
[0] => field_5b5947ce6e6c3
)
[download_description_1_image_row_1_lightbox] => Array
(
[0] => 1
)
[_download_description_1_image_row_1_lightbox] => Array
(
[0] => field_5b5947836e6c1
)
[download_description_1_image_row_1_gallery] => Array
(
[0] => a:1:{i:0;s:5:"80786";}
)
[_download_description_1_image_row_1_gallery] => Array
(
[0] => field_5b5947a86e6c2
)
[download_description_1_image_row_1_row_id] => Array
(
[0] => 649d6e0f508dd
)
[_download_description_1_image_row_1_row_id] => Array
(
[0] => field_5b5947ce6e6c3
)
[_edd_download_limit_override_34805] => Array
(
[0] =>
)
[_edd_download_limit_override_35321] => Array
(
[0] =>
)
[_edd_download_limit_override_40045] => Array
(
[0] =>
)
[_edd_download_limit_override_63326] => Array
(
[0] =>
)
[_edd_download_limit_override_37055] => Array
(
[0] =>
)
[_edd_download_limit_override_53159] => Array
(
[0] =>
)
[_edd_download_limit_override_53189] => Array
(
[0] =>
)
[edd_sku] => Array
(
[0] =>
)
[_edd_download_limit_override_37509] => Array
(
[0] =>
)
[_edd_download_limit_override_55976] => Array
(
[0] =>
)
[_edd_download_limit_override_63328] => Array
(
[0] =>
)
[_edd_download_limit_override_63322] => Array
(
[0] =>
)
[_edd_download_limit_override_41767] => Array
(
[0] =>
)
[_edd_download_limit_override_54353] => Array
(
[0] =>
)
[_edd_download_limit_override_39021] => Array
(
[0] =>
)
[_edd_download_limit_override_53193] => Array
(
[0] =>
)
[_edd_download_limit_override_63332] => Array
(
[0] =>
)
[download_description_1_image_row_2_image] => Array
(
[0] =>
)
[_download_description_1_image_row_2_image] => Array
(
[0] =>
)
[download_description_1_image_row_2_lightbox] => Array
(
[0] =>
)
[_download_description_1_image_row_2_lightbox] => Array
(
[0] =>
)
[download_description_1_image_row_2_gallery] => Array
(
[0] =>
)
[_download_description_1_image_row_2_gallery] => Array
(
[0] =>
)
[download_description_1_image_row_2_row_id] => Array
(
[0] =>
)
[_download_description_1_image_row_2_row_id] => Array
(
[0] =>
)
[download_description_4_image_row_2_image] => Array
(
[0] =>
)
[_download_description_4_image_row_2_image] => Array
(
[0] =>
)
[download_description_4_image_row_2_lightbox] => Array
(
[0] =>
)
[_download_description_4_image_row_2_lightbox] => Array
(
[0] =>
)
[download_description_4_image_row_2_gallery] => Array
(
[0] =>
)
[_download_description_4_image_row_2_gallery] => Array
(
[0] =>
)
[download_description_4_image_row_2_row_id] => Array
(
[0] =>
)
[_download_description_4_image_row_2_row_id] => Array
(
[0] =>
)
[download_description_10_title] => Array
(
[0] =>
)
[_download_description_10_title] => Array
(
[0] =>
)
[download_description_10_content] => Array
(
[0] =>
)
[_download_description_10_content] => Array
(
[0] =>
)
[_thumbnail_id] => Array
(
[0] => 85989
)
[_edit_lock] => Array
(
[0] => 1724396472:7
)
[_edit_last] => Array
(
[0] => 8
)
[download_thumbnail] => Array
(
[0] => 86564
)
[_download_thumbnail] => Array
(
[0] => field_65dfe4f92ef0e
)
[_ct_other_template] => Array
(
[0] => 0
)
[_ct_template_archive_post_types_all] => Array
(
[0] =>
)
[_ct_template_categories] => Array
(
[0] => a:0:{}
)
[_ct_template_categories_all] => Array
(
[0] =>
)
[_ct_template_tags] => Array
(
[0] => a:0:{}
)
[_ct_template_tags_all] => Array
(
[0] =>
)
[_ct_template_custom_taxonomies] => Array
(
[0] => a:0:{}
)
[_ct_template_custom_taxonomies_all] => Array
(
[0] =>
)
[_ct_template_authors_archives_all] => Array
(
[0] =>
)
[_ct_template_index] => Array
(
[0] =>
)
[_ct_template_front_page] => Array
(
[0] =>
)
[_ct_template_blog_posts] => Array
(
[0] =>
)
[_ct_template_date_archive] => Array
(
[0] =>
)
[_ct_template_search_page] => Array
(
[0] =>
)
[_ct_template_inner_content] => Array
(
[0] =>
)
[_ct_template_404_page] => Array
(
[0] =>
)
[_ct_template_all_archives] => Array
(
[0] =>
)
[_ct_template_archive_among_taxonomies] => Array
(
[0] => a:0:{}
)
[_ct_template_apply_if_archive_among_taxonomies] => Array
(
[0] =>
)
[_ct_template_archive_post_types] => Array
(
[0] => a:0:{}
)
[_ct_template_apply_if_archive_among_cpt] => Array
(
[0] =>
)
[_ct_template_authors_archives] => Array
(
[0] => a:0:{}
)
[_ct_template_apply_if_archive_among_authors] => Array
(
[0] =>
)
[_ct_template_single_all] => Array
(
[0] =>
)
[_ct_template_post_types] => Array
(
[0] => a:0:{}
)
[_ct_template_exclude_ids] => Array
(
[0] =>
)
[_ct_template_include_ids] => Array
(
[0] =>
)
[_ct_template_taxonomies] => Array
(
[0] => a:2:{s:5:"names";a:0:{}s:6:"values";a:0:{}}
)
[_ct_use_template_taxonomies] => Array
(
[0] =>
)
[_ct_template_post_of_parents] => Array
(
[0] => a:0:{}
)
[_ct_template_apply_if_post_of_parents] => Array
(
[0] =>
)
[_ct_template_order] => Array
(
[0] => 0
)
[_ct_builder_shortcodes] => Array
(
[0] =>
)
[_oxygen_lock_post_edit_mode] => Array
(
[0] =>
)
[_a3_pvc_activated] => Array
(
[0] => false
)
[cmplz_hide_cookiebanner] => Array
(
[0] =>
)
[_edd_download_gross_sales] => Array
(
[0] => 58
)
[_edd_download_gross_earnings] => Array
(
[0] => 0
)
[_qa_3_question] => Array
(
[0] => field_65b18f3b3aabc
)
[qa_3_question] => Array
(
[0] => I need specific data about my industry, do you offer customized reports?
)
[_qa_3_answer] => Array
(
[0] => field_65b18f433aabd
)
[qa_3_answer] => Array
(
[0] => Yes! From preliminary eCommerce scans that inform your market entry strategy, to monthly data checks, and long-term monitoring, we offer custom data collection and analysis to help identify your industry's market structure, pricing, top competitors, trends, and more. To learn more, navigate to our "Data Service" page in the main menu or contact us to discuss your data needs.
)
[_banner_title] => Array
(
[0] => field_6650573688572
)
[banner_title] => Array
(
[0] => Need specific data for your business?
)
[_button_text] => Array
(
[0] => field_6650576288573
)
[button_text] => Array
(
[0] => Customize your report
)
)