

Primarily led by structural lifestyle changes related to recreation and wellbeing, online revenue for outdoor equipment across major Southeast Asian markets is projected to reach USD 200 million in 2025, with a CAGR of 6.3% through 2030. What was once discretionary spending on leisure equipment has stabilized into habitual consumption supported by marketplace logistics and low entry prices. That trajectory places it firmly among the region’s most resilient online retail consumer categories, alongside Beauty, Home Appliances, and F&B.
Drawing on SKU-level sales data from TMO Group’s Market Insider platform for marketplace intelligence, this article breaks down the top-performing categories, market-by-market sales differences, and the product-level strategies behind Sports & Outdoor eCommerce growth across six SEA countries in Shopee and Lazada.
This article is based on the Sport & Outdoor (Southeast Asia Outlook September 2025)This PDF report looks at the online sport and outdoor market in Southeast Asia: market segments, price ranges, popular brands, and much more.Southeast Asia Sports & Outdoor Outlook, which you can download for free to see the full data from our research.
1. Sports Market Overview: Main Categories in SEA
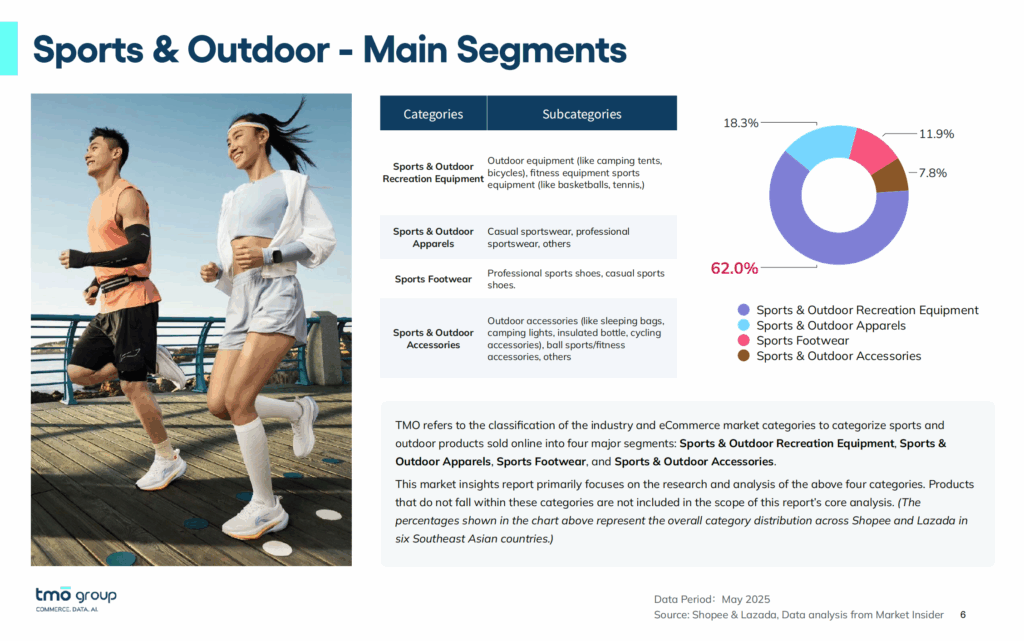
TMO Group classifies the regional sports and outdoor eCommerce market into four segments: Recreation Equipment, Apparel), Footwear, and Accessories.
| Segment | Share of Online Sales | Typical Product Types | Notes |
|---|---|---|---|
| Recreation Equipment | 62% | Camping, cycling, fitness, and team-sport gear | High transaction value, durable goods |
| Apparel | 18.3% | Sportswear sets, T-shirts, swimwear, leggings | High frequency, price-sensitive |
| Footwear | 11.9% | Running, soccer, futsal, casual sports shoes | Stable premium tier |
| Accessories | 7.8% | Umbrellas, protective gear, bottles, gloves | Rapid growth but low unit value |
Recreation Equipment
Recreation equipment accounts for nearly two-thirds of total sales value because of larger basket sizes and longer product lifecycles.
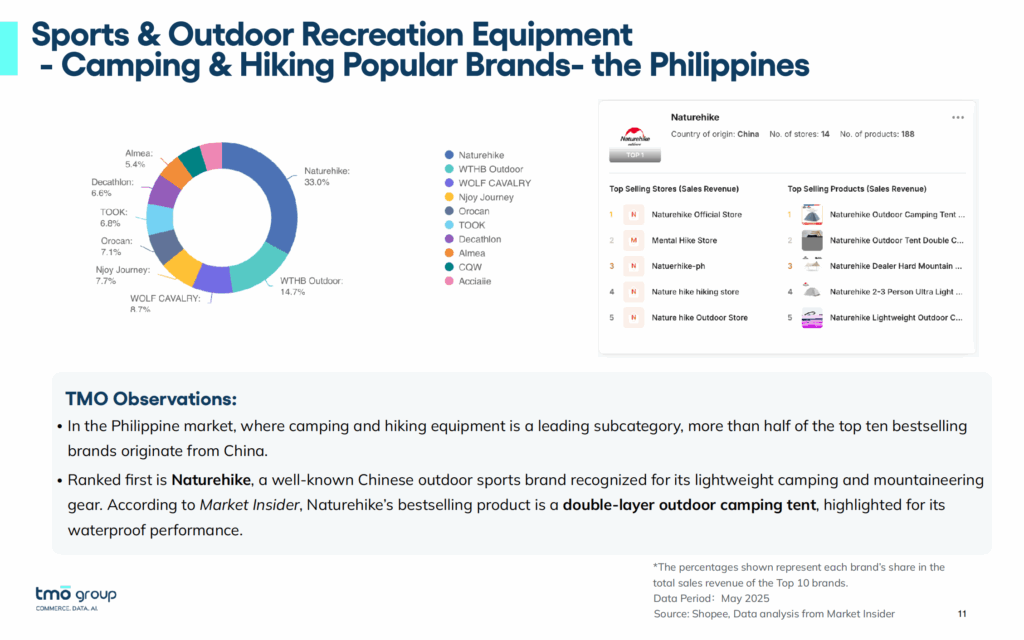
- Philippines dominance: Camping and hiking gear, together with fitness equipment, generate over 50 percent of monthly revenue.
- Price band concentration: Sales volume peaks in the sub-USD 2.5 range, but the majority of revenue occurs above USD 23, reflecting a shift from single-use disposable items toward mid-range functional goods.
- Category characteristics: Durability, portability, and clear technical specification are the primary purchase triggers. Reviews emphasize material quality and ease of assembly more than brand prestige.
The data suggests that in this category, functional reliability outweighs branding. Western manufacturers with verifiable standards such as Decathlon retain pricing stability, while smaller importers compete mainly through low logistics costs.
Apparel
Sportswear is the most fragmented segment and illustrates the diversity of Southeast Asia’s income structure.
- Vietnam reports one of the region’s highest monthly revenues. Bottoms and sets dominate, supported by frequent repurchase behavior.
- Two price clusters emerge: a mass band between USD 0.5 and 3.5, and a smaller premium cluster from USD 7.5 to 11.5
- In the lower cluster, domestic sellers and cross-border marketplaces control volume; in the upper cluster, international brands capture consumers seeking consistent fit and material quality.
Western brands maintain visibility primarily in the premium cluster. Fabric technology, sizing accuracy, and design coherence sustain their price position, though total market share remains small relative to the mass tier.
Footwear
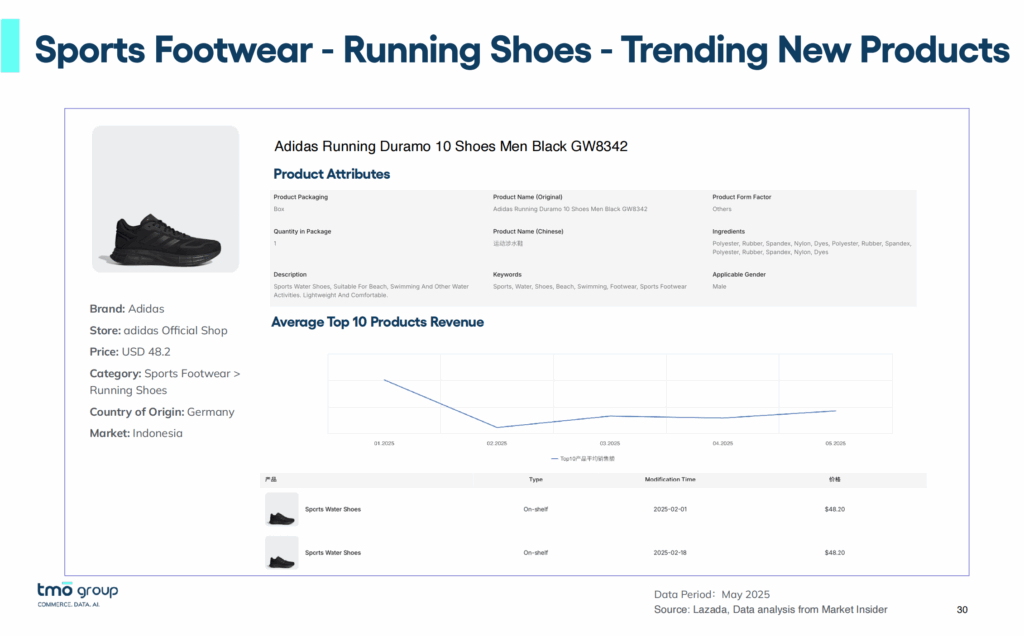
Indonesia drives footwear performance in the region.
- Running shoes form the largest subcategory, followed by soccer and futsal footwear
- Revenue concentration occurs in the USD 44 and above range, where Adidas, PUMA, and Asics maintain consistent conversion rates despite cheaper local competitors
- Lower tiers (USD 9–27) yield high volume but volatile margins.
- Eight of the ten top stores are official brand shops, confirming that authenticity verification affects purchase decisions.
Footwear shows the clearest boundary between brand-led and price-led markets. Reputation, design validation, and warranty coverage outweigh short-term promotions.
Accessories
Accessories occupy the smallest share but post the fastest growth rate across 2025. Thailand’s sales data exemplifies the pattern.
- Umbrellas, rainwear, and gym protective gear led subcategory growth
- Adidas and McDavid (U.S.) recorded strong sales in protective gear, with average prices between USD 10 and 25
- Volume remains concentrated under USD 1.5, but profit accrues above USD 10.5, where branded goods command trust.
Looking to boost your eCommerce competitive intelligence? Our Customized Marketplace Reports are tailored to support your brand’s data needs with detailed analysis.
For brands, this means category entry is only step one. To succeed in Southeast Asia, SKUs must be localized in format, highlighted functional claims, and pricing strategy. Using country-specific sales data ensures you're not just entering the right category, but doing it the right way.
2. Best-selling Sports Brands in SEA
Western brands retain visible traction in Southeast Asia’s sports and outdoor eCommerce ecosystem, especially in categories where performance and product integrity are verifiable. Their strength rests on operational discipline, which can be seen by accurate listings, reliable logistics, and warranty transparency rather than promotional spending.
According to the dataset, Adidas, Nike, PUMA, Asics, McDavid, and Decathlon rank among the region’s most frequently listed and best-selling international brands. They consistently occupy upper-tier price ranges, while local and Chinese sellers dominate the volume-driven base.
| Price Tier | Typical Range (USD) | Representative Western Brands | Core Advantage |
|---|---|---|---|
| Premium | 40 – 65 | Adidas, Nike, PUMA, Asics | Verified quality, performance materials |
| Mid-Range | 10 – 25 | Decathlon, McDavid | Functionality, omnichannel distribution |
| Entry / Mass | < 10 | Local & Chinese sellers | Price flexibility, rapid SKU rotation |
Observed Consumer Behavior
- Preference for verification: In Indonesia and Thailand, official brand stores generate the majority of category revenue, confirming that platform-verified authenticity drives conversion.
- Durability over discounting: Reviews highlight material reliability and fit accuracy as stronger motivators than temporary price reductions.
- Platform trust linkage: Listings with full specifications, warranty information, and brand-verified badges outperform unverified resellers.
- Cross-market reinforcement: Buyers familiar with global brands in one country transfer that trust across other ASEAN marketplaces, lowering acquisition costs.
Key Takeaways
- Western brands retain competitive advantage where product integrity can be measured objectively: durability, fit, material, or verified store presence.
- Price compression at the lower tiers is unlikely to dislodge these positions; cost-led entrants compete on scale, not perceived reliability.
- Sustained growth depends on local fulfillment and accurate SKU data rather than additional brand storytelling.
These observations align with patterns in other consumer-durable segments: functional consistency and channel verification, not aggressive pricing, determine long-term resilience.
Learn SwisseThrough customized data research and analytics, TMO helped Swisse understand the competitive landscape for the Health Supplements market in Southeast Asia.how top brands selling in SEA's marketplaces rely on custom data collection to guide their competitive intelligence in the region.
3. High‑Performing SKU Attributes
The SKU-level data from Shopee and Lazada reveal that successful listings share consistent operational and functional characteristics. These attributes directly affect conversion, review stability, and repeat purchase potential across markets.
Functional Clarity and Specific Use-Cases
Products that emphasize a defined benefit outperform those marketed through generic lifestyle claims.
- Listings that specify function (e.g. “waterproof hiking tent,” “shock-absorbent running shoes,” “breathable compression top”) achieve higher visibility and lower return rates.
- Abstract or multi-purpose descriptors underperform because buyers in this category often shop for immediate, functional needs rather than aspirational aesthetics.
Technical Transparency
Consumers consistently respond to measurable product data.
| Attribute | Observation | Conversion Effect |
|---|---|---|
| Material disclosure | References to recognized standards (e.g., “Ripstop 210D polyester,” “EVA midsole,” “stainless steel frame”) | Increases buyer confidence |
| Specification detail | Weight, dimensions, capacity, and pressure ratings where applicable | Reduces uncertainty and disputes |
| Verified imagery | High-resolution photos showing scale and texture | Correlates with higher review scores |
| Packaging cues | Items shipped with protective or branded packaging receive fewer damage complaints | Supports perceived value |
The correlation between product transparency and repeat purchase rate is strongest in mid- and high-tier price bands, where consumers expect accuracy proportional to cost.
Localization and Climate Fit
High-performing SKUs align with Southeast Asia’s climatic and practical conditions.
- Lightweight, quick-drying, and UV-resistant materials are frequently cited in top reviews.
- Compact, portable designs (foldable chairs, small tents, or fitness supports) match urban living spaces and multi-use behavior.
- Listings mentioning regional relevance (e.g., “suitable for tropical humidity”) rank higher in local-language searches.
Trust and Platform Verification
Trust signals remain critical in final purchase decisions.
- SKUs sold through official brand stores or with verified badges outperform independent listings at similar price points.
- Verified badges reduce perceived counterfeit risk, which remains a deterrent for high-value products.
- Extended return windows and warranty visibility further support conversion, particularly for footwear and equipment.
Bundling and Value Engineering
Effective sellers use bundling to increase average order value without heavy discounting.
Examples include:
- Camping sets combining tent, stakes, and groundsheet.
- Gym gear kits including wrist and knee supports.
- Apparel packs pairing tops with socks or accessories.
These bundles function as price anchors, reinforcing perceived value while maintaining margin structure.
Summary of Shared Traits Among Top SKUs
| Factor | Description | Impact on Sales Stability |
|---|---|---|
| Clear primary function | Defined performance purpose | Higher search relevance |
| Technical specificity | Transparent specifications and materials | Fewer returns |
| Localized usability | Adapted to SEA climate and space constraints | Broader appeal |
| Verified sales channel | Official or authorized stores | Sustained revenue share |
| Structured bundling | Complementary product packaging | Increased order value |
Across the dataset, these attributes appear repeatedly regardless of category or brand origin. The market rewards sellers who communicate precision and trust rather than broad lifestyle messaging. Western brands already follow many of these practices by default, which partially explains their continued pricing resilience in Southeast Asia.
4. Growing your Brand in SEA through Data-backed Localization
The 2025 data confirms that Southeast Asia’s sports and outdoor eCommerce market has matured into a stable, segmented system. Volume expansion continues at the lower end, but durable revenue now concentrates among sellers that operate with accuracy and verifiable quality.
Southeast Asia’s sports and outdoor category will continue to expand as disposable income and urban recreation rise. The opportunity is not only in sales volume but in process optimization (how efficiently brands can translate product integrity into scalable digital operations). Western companies that apply disciplined product management and flexible pricing models remain positioned to capture long-term value across ASEAN’s diversified consumer base.
Learn how TMO's data services for market intelligence can provide your brand with real sales data across Shopee and Lazada, with insights by subcategory and SKU-level performance.
As part of our comprehensive Southeast Asia eCommerce solutions, TMO Group helps clients dive deeper into Southeast Asia’s eCommerce market with our thorough research and analysis, as well as customized reports for various industries, providing a deep understanding of your niche, including market structure, size, and emerging trends.