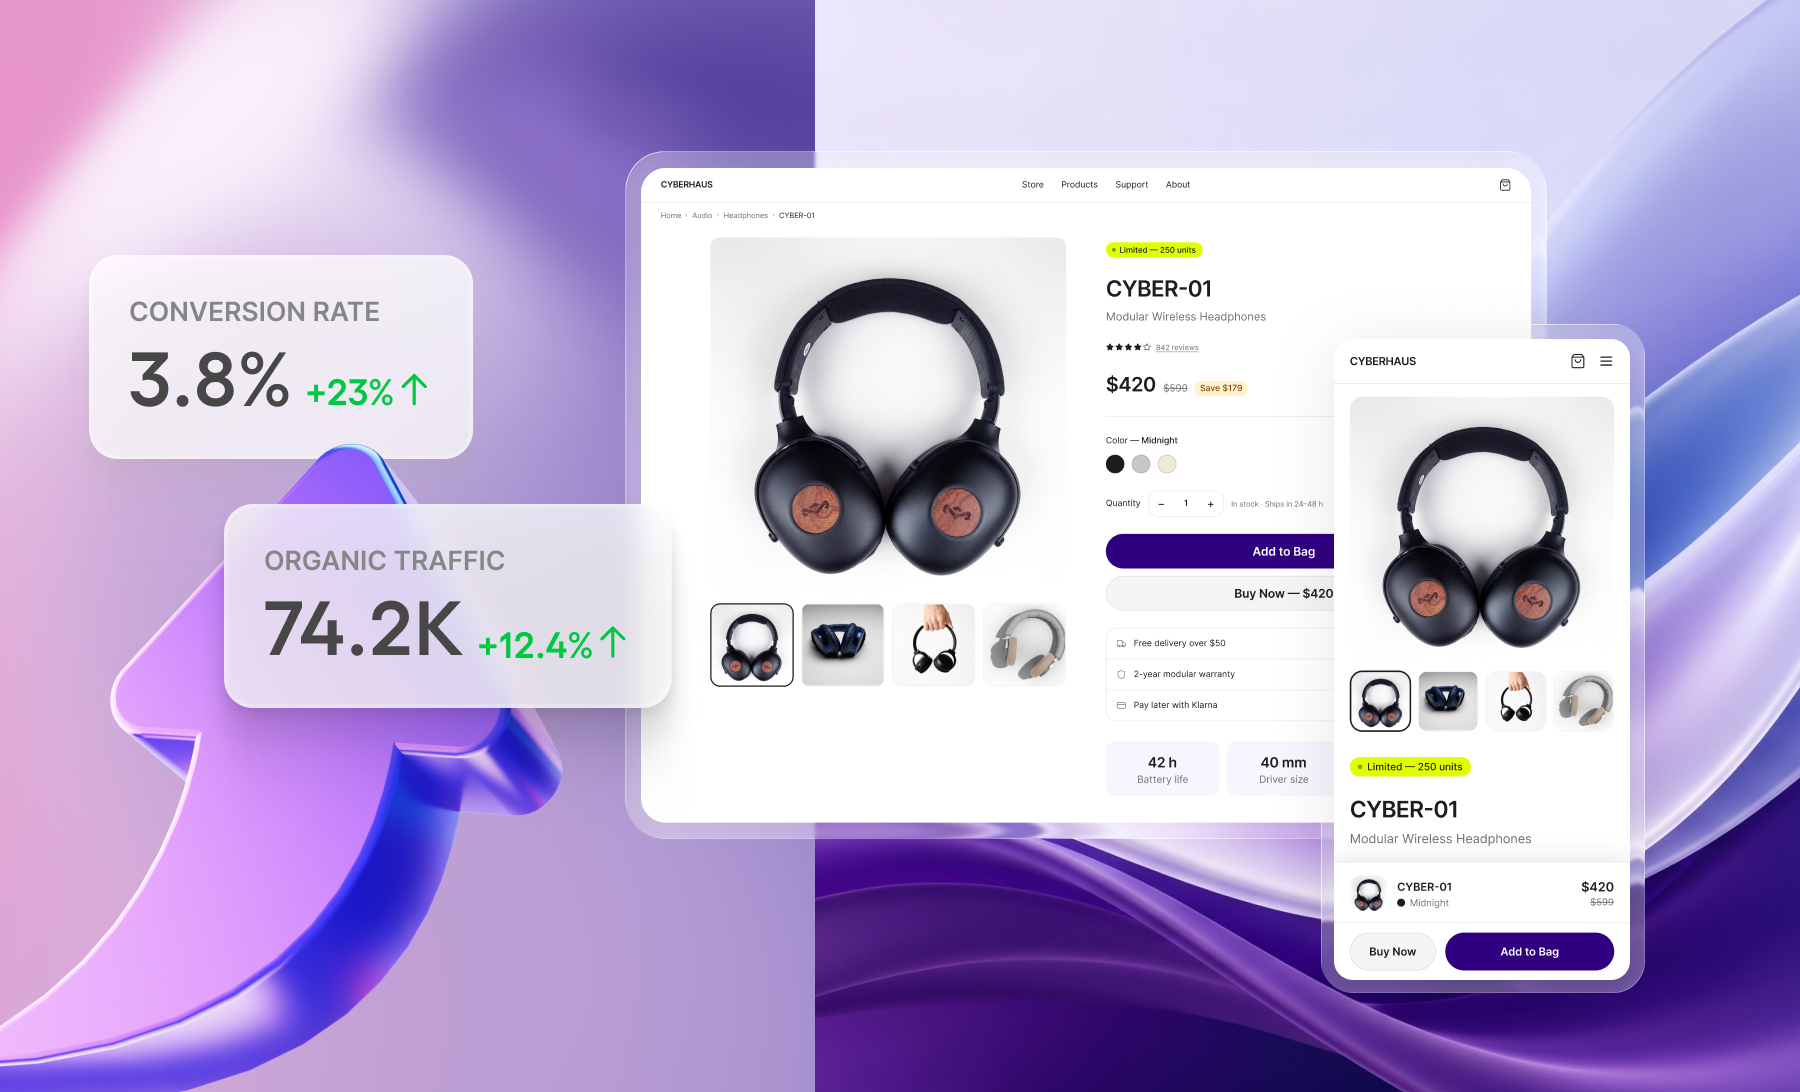


According to Baymard, average cart abandonment rates is approximately 70%. On mobile, this rate is typically even higher, often exceeding 80%. Meanwhile, the average conversion rate in eCommerce varies significantly across product categories. While is it not surprising to find F&B rates above 6%, Jewelry consistently hovers at 1% or below.
This means that, if you are treating Conversion Rate as an overall KPI, you might be missing the bigger picture, and while overall CVR might signal a performance problem, it can hardly help drive your store's optimization efforts.
So where to start looking? In this article, we look at 6 tips to break down conversion analysis into a more structure approach that can help identify where exactly conversion loss is happening so you can prioritize your store optimization efforts.
As part of our Conversion Optimization Program, TMO is selecting a limited number of D2C brands for a zero-cost diagnostic audit and optimization roadmap.
1. Locate Frictions within the Funnel
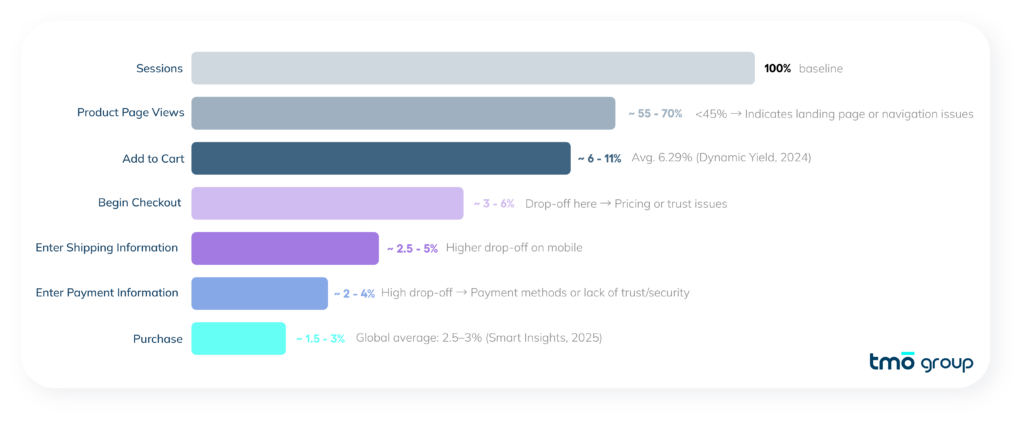
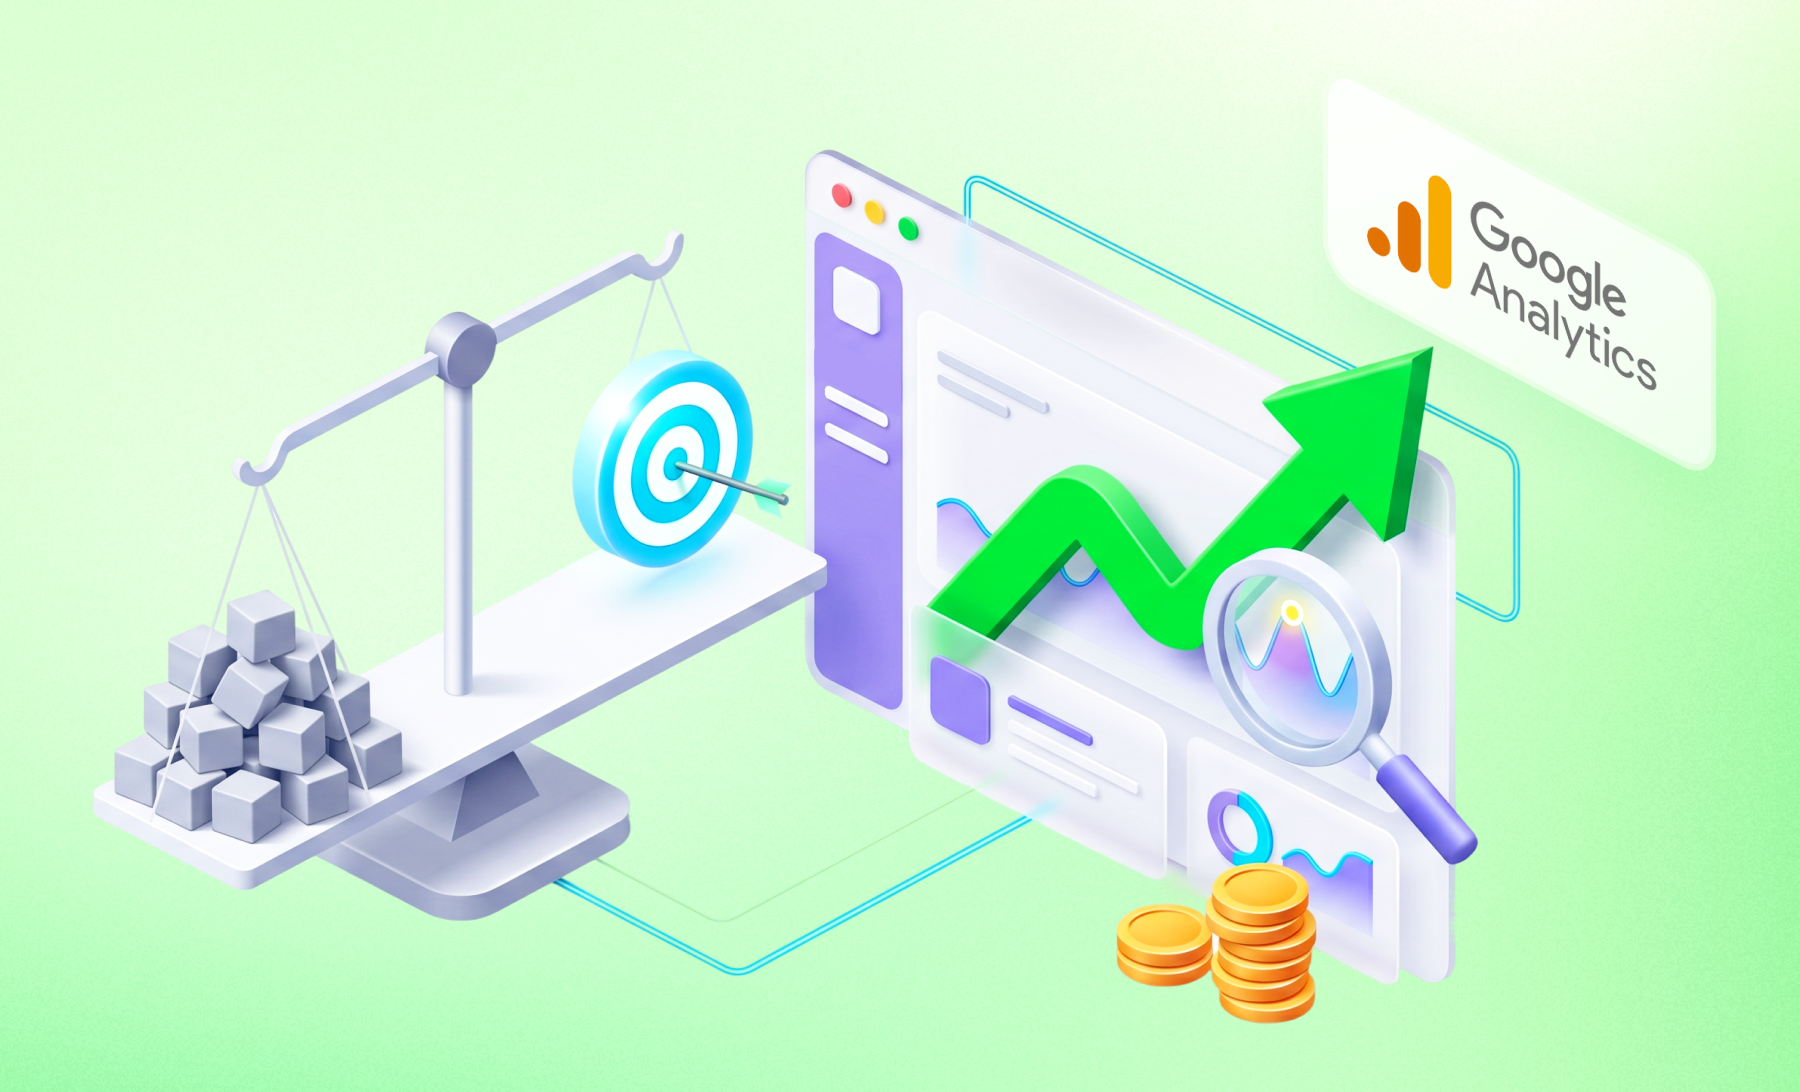
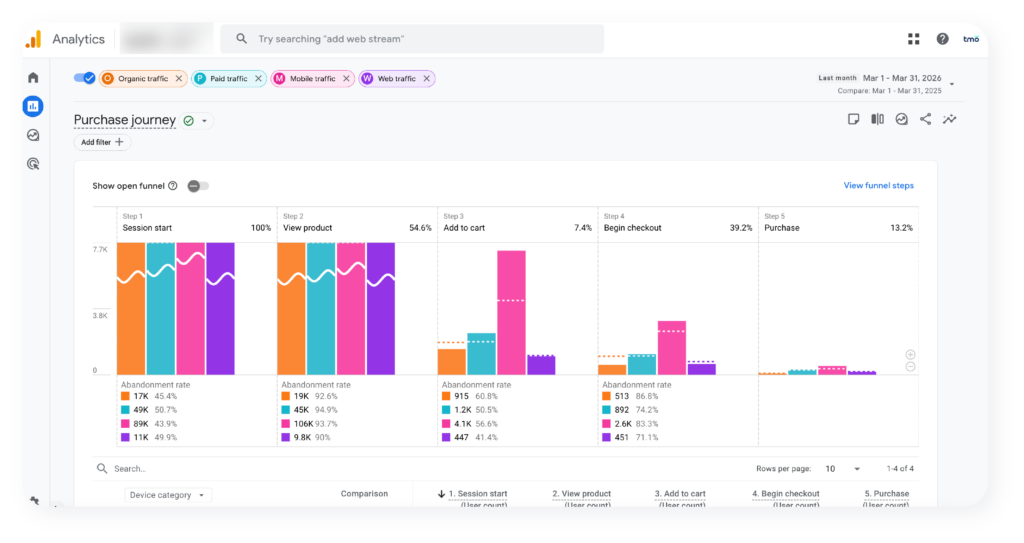
Diagnosis begins by deconstructing the purchase journey into distinct nodes. Using GA4’s Purchase Journey reports, we can visualize the funnel to isolate specific leaks. Each drop-off points to a fundamentally different business problem:
| Funnel Stage | Key KPIs | Possible Friction |
|---|---|---|
| Top of Funnel | Session Start to Product View (Target: >45%) | If low, indicates issues with landing page relevance, navigation, or brand trust. |
| Product Engagement | Add to Cart Rate (Avg. 6.29%, Dynamic Yield 2024) | If low, suggests poor product persuasion, pricing issues, or lack of social proof. |
| Checkout Flow | Begin Checkout to Purchase | If high abandonment, indicates friction in forms, lack of payment options, or hidden costs. |

2. Segment Before Interpreting
A funnel analysis tells you where the leak is, but segmentation tells you who it affects. A conversion issue is rarely universal, so breaking the funnel down by variables like device, traffic source, or geography often changes the diagnosis entirely.
a) Mobile Gaps
Mobile accounts for over 75% of global eCommerce traffic, yet mobile conversion rates (1.5% to 2.0%) are typically half those of desktop. In our audit projects, we consistently find that mobile friction, often caused by responsive layouts acting as an afterthought in standard themes, is the largest driver of lost revenue.
b) Traffic Source Disparity
Organic users often have stronger intent, whereas paid traffic quality depends heavily on ad targeting. If you see a dip in overall conversion but do not separate these sources, you might blame the website when the real issue is a low-quality ad campaign.
c) Geographic and Market Maturity
For global brands, segmentation by geography is vital. Entering a new market requires a different trust-building strategy compared to a mature market. Mixing data from a new market, where low conversion is expected, with a mature market leads to misleading conclusions that mask underperformance in specific regions.
3. Reading Performance in Context
Before acting on a low conversion figure, ensure you are judging the numbers in the right reference frame. The question "Is 1.8% conversion bad?" cannot be answered without knowing your category and stage.
- Category Benchmarks: Global eCommerce conversion rates in 2024 and 2025 averaged around 2.5% to 3.0%, but for industries like Food and Beverage (>6.0%) Luxury (<0.95%) a standard benchmark should not be used. For example, a high-ticket brand with 1.8% conversion might actually be performing okay.
- Brand Awareness: A brand well-known in its home market will see lower conversion when first entering a new market as it builds consumer confidence.
- Decision Cycles: High-price, complex items naturally have lower conversion rates because users require more education and longer consideration periods compared to fast-moving consumer goods (FMCG).

4. Validating with Page-Level Evidence

The funnel provides the address of the problem, but behavior data provides the cause. By assessing things like engagement metrics, heatmaps, or session recordings, you can turn symptoms into actionable hypotheses. Consider these scenarios:
- Layout Issues: Heatmaps show users focus on the top of the page but miss core product details because they are buried below the fold.
- Content Issues: Users frequently click on product images, but the lack of high-quality, multi-angle shots prevents them from committing.
- Technical Issues: Rage clicks on the "Add to Cart" button reveal a technical bug, for example, the button does not respond on certain mobile browsers.
- Performance Issues: Every 1 second delay in mobile load time can decrease conversion by approximately 7%. If load time increases from 1 to 5 seconds, the bounce probability increases by 90% (Google Mobile Research, 2024).
5. Categorizing the Problem
Once the data is in, you must categorize the problem to ensure the right team is assigned to the fix.
- Traffic Quality and Intent Mismatch: High traffic but low browse depth. This is a marketing problem, meaning your ads are bringing the "wrong people" to the site. No amount of page optimization can fix a fundamental lack of intent.
- UX and Page Experience Friction: Users want to buy but struggle with the interface. This is the core domain of CRO, requiring improvements in layout, content strategy, and trust signals like reviews.
- Checkout Flow Friction: High-intent users drop off at the final stage. Solutions include adding localized payment methods, such as PayPal or Apple Pay, allowing guest checkout, and showing all costs including shipping and tax upfront.
6. Prioritization Principles
With limited resources, the following principles should guide your roadmap:
- Evidence over Intuition: If heatmaps show a broken mobile element, fix that first. It is a quick win with clear proof and controlled costs.
- Mid-Funnel over Top-Funnel: It is more cost-effective to push a high-intent user through the final checkout than to convert a cold, new visitor into a buyer.
- Impact on Volume: If 70% of your traffic is mobile, a 0.5% lift in mobile conversion will outweigh any marginal gains on desktop.
- Quick Wins vs. Long-Term Levers: Fix technical bugs in days, but plan for a long-term content strategy to build brand trust. Both are needed, but they should not compete for the same immediate resources.
We previously covered how to improve user experience and conversion in High-consideration industries:

Better Questions Lead to Better Results
When you ask the right questions, you look at the right data. When you look at the right data, you form better hypotheses, and better hypotheses lead to meaningful growth. For global brands, the challenge is often the lack of a systematic diagnostic framework that aligns marketing, design, and technical teams.
If your team is struggling to see ROI from your optimization efforts, we invite you to explore our eCommerce CRO Services or contact our consultants for an initial audit.
Frequently Asked Questions (FAQ)
Break down your user's purchase journey by key steps, such as product view, add-to-cart, and checkout, and compare drop-off rates at each node to pinpoint the leak.
F&B: 4-6%; Personal Care: 3-5%; Home & Appliances: 1.5-3%; Luxury: 0.5-1.5%. Always benchmark against your specific brand's context.
Usually three: Low-intent traffic, UX/UI flaws, or Checkout friction. Each requires different optimization.