
“How well is your business doing?” – if you don’t have a specific numerical answer to this question, you probably need to brush up on the basic analytics for eCommerce. Analytics is not just an indicator of the current health of your eCommerce enterprise. It is a powerful way to diagnose any issues you may be having in the future and a tool to find the most efficient solution.
In this article we’ll look at the most important metrics you encounter in eCommerce analytics, how they are measured and what steps you can take to improve them.
Sales conversion rate (CR)
One of the most basic analytical indicators used in eCommerce is sales conversion rate – percentage of your website visitors who made a purchase.
How to calculate Sales Conversion Rate
To calculate conversion rate, divide the number of users who made purchases by the total number of visitors of your website:
![]()
One of the most popular ways to measure conversion is the use of “Goal” functionality in Google Analytics. This way you can see the conversion rate together with the rest of the web behavior data GA has to offer.
There is no universally “good” conversion rate – it depends on a variety of factors: traffic source, platform, nature and price of your products. 1% conversion rate can be a stunning success in one situation and dismal failure in another. However, there are a number of articles trying to establish an average benchmark for different industries. According to the data they provide, sales conversion in the majority of industries fall in the 2-4% range.
How to improve conversion rate
Low conversion rate is one of the most fundamental problems for your eCommerce project. There are countless books and articles dedicated to exploring this issue. Here are a few most popular reasons for low conversion numbers and potential improvement solutions.
- Are you attracting the right traffic? Targeting the wrong audience is very likely the case if you see lower conversion rate for a particular marketing channel.
- Does your site work correctly on all platforms and devices? Do pages load quick enough? Technical issues and slow loading speed is one of the popular reasons for losing potential customers and low conversion numbers.
- Can users easily navigate your site? If users cannot find what they were looking for, they are likely to leave, bringing the conversion rate down.
- Is the purchasing smooth and effortless? Complex and long checkout process is also likely to drive customers away.
Often even small and mundane details can have an effect on conversion: from the wording you have on the buttons to colors you use in the website design. To find options that result in the best conversion, eCommerce marketers use AB-test: randomly show two different variations, measuring conversion for each one.
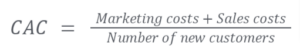
Customer Acquisition Cost (CAC)
Next metric is a basic way to measure the efficiency of your sales and marketing activities: customer acquisition cost. It measures the average amount of money you spend, to get a new customer.
How to calculate Customer Acquisition Cost
To calculate CAC, you will need to add up all the costs associated with acquiring customers (both marketing and sales-related), and divide it by the number of new customers you have got:
Some channels (for example paid search advertising) can calculate CAC automatically, based on your spendings and completed web behavior goals. But in many cases calculation of actual costs will require some manual data collection. In practice, it may be somewhat challenging to measure the costs exactly, as some of them (personnel costs, for example) are usually shared with other projects and tasks within a company. Yet, even an approximate information about your CAC is a powerful tool to diagnose and optimize your sales funnel.
If you are able to split costs between different channels, you can calculate CAC for each one individually. Find the channels with high CAC and check if there is a way to reduce the cost there – or even stop using channels, if customers acquired through them are too expensive. On the other hand, prioritize and grow channels that bring you new customers with low CAC.
How to reduce CAC
Reducing CAC comes down to two activities: either to reduce the top part of the fraction (costs), or increase the bottom part of it (number of customers).
It’s not easy to cut costs, but try to find the expenses that don’t return enough bang for your buck. Is there a segment that is too difficult to convert? Is there a keyword group that indicates a very low level of interest that almost never results in sales?
To bring down CAC by increasing your sales numbers, use all the tools and methods you have to increase conversion. Make sure customers can easily find the item they are looking for and once they are ready to buy, the checkout process is smooth and effortless.
Cart Abandonment Rate
If you think that when a user puts an item in their shopping cart, your work is done – you may need to think again. According to some research, up to 70% of users will never end up buying the product after placing it in a cart. This number can be even higher for mobile eCommerce.
The rate with which users leave the cart is called Cart Abandonment Rate and it is one of the crucial characteristics of your eCommerce performance.
How to calculate Cart Abandonment Rate
As most of the time you have data for people completing transaction, rather than people leaving, the cart abandonment is calculated using people completed a sale and people started a sale (put something in their cart):
![]()
There are several ways to automate tracking of cart abandonment – maybe your eCommerce solution has a built-in way to do that, or it can do it with the help of a plugin. Google Analytics can be used to calculate abandonment rate; to do that, you will have to create a “Funnel” type goal and provide distinct URLs for different stages of the purchase.
How to reduce Cart Abandonment
Of course you can never bring cart abandonment to zero – there are always going to people who add items to the cart by mistake or did that just to check out the cost of delivery.
There are studies that try to measure average Cart Abandonment Rate across different industries. They found that average abandonment is at the level of 70% with numbers being even higher for mobile traffic.
Most of the time, Cart Abandonment is almost always an indicator of how smooth and user-friendly your checkout process is. If it is too high – here some areas to check:
- Were users surprised by additional costs they saw on the Checkout page? Is there any hidden cost that you are not displaying on the product page? Are the delivery fees unexpectedly high? According to research, it is the extra cost that causes about a half of all unfinished transactions.
- Does a user have to create an account to proceed? In our age of privacy protection leaving your details may be an extra effort, some users would choose not to make.
- Is your website fast enough? Studies suggest that every three seconds of waiting time would cut the number of people completing the transaction in half.
Average Order Value (AOV)
Average Order Value (AOV) is the amount of money a customer spends in your shop when they make a purchase. To calculate it, divide your total revenue (which is the sum of all orders) by the number of orders.

It is common to measure AOV for a certain period of time - for example, monthly or yearly average. AOV is a great way to get understanding of your customers' purchasing habits.
How to improve AOV
Great thing about AOV is that improving it does not require a lot of extra resources. If, for example, increasing website traffic most probably would incur some cost, you can improve your AOV just by creating and adjusting your offers. Here are a few ways:
- Cross-selling and bundling: offer products that go together with what users already have in the cart. Prepare ready-to-buy sets of such products - with a small discount to incentivise the purchase.
- Upselling and volume discount: offer discount (or other perks, like free shipping), if the user would opt for a bigger volume or higher tier of the product they already chose.
- Time-bound offers, loyalty points, coupons - this is where you can get creative, crafting the incentives that would make prospective customers spend a little bit more.
Churn rate / re-purchasing rate
Churn rate (also known as attrition rate) is one of the crucial metrics for eCommerce, especially if your business model heavily uses regular purchases and subscriptions. In simple terms, it is a share of customers you lose over a period of time.
How to calculate Churn Rate
Here’s how to calculate it:

A few things to note:
- When calculating remaining customers - use only those that were there in the beginning, not the new ones you might have got during this time.
- Churn rate is always calculated for a certain period of time: most commonly for a month, a quarter, a year.
- The period you use should be longer than the intervals between purchases for most users.
Churn rate is an important step in calculating another important metric we’ll talk about in this post: Customer Lifetime Value.
Sometimes you can encounter the opposite metric, 1 – Churn rate, is known as repurchase rate or stickiness rate.
How to reduce churn rate
Reducing churn is one of the ways to increase your profitability. It may be way more efficient for your business to keep more of existing customers, rather than constantly try to replace churn with new ones.
Here are a few ways to do that:
- First of all: analyze the churn values across different departments, product groups, customer segments. High churn rate within one of the groups is often an indicator of a customer experiencing problems. Locating these problems is the first step to fixing them.
- Revamp your customer service: add an onboarding program for your customers to smooth out any issues they may have, train the sales and customer service teams to handle customer issues more efficiently.
- Collect feedback to understand better what are the issues that frustrate your customers most. You can even be proactive during the high-churn-risk moment in the customer lifecycle – helping them sort potential issues out and adding perks to motivate them to renew their relationship with you.
Customer Lifetime Value
Customer Lifetime Value (shortened to CLV or LTV) is an expected amount of revenue a company can expect from an average customer throughout the relationship with this customer.
Together with Customer Acquisition Rate, the CTV is used to estimate and forecast profitability and stability of the business. It can be used to identify the most and least promising segments of the business, affecting the future strategic development of the company.
How to calculate CLV
Calculating the CLV is the most complex of all we had in this post, so let’s break it down into several steps.

AOV is the Average Order value we already discussed in this post.
Average number of orders is calculated for a certain period of time as:

Average number of orders is calculated for a certain period of time - most often a month of a quarter. It is a good idea to look at a longer period for calculating the average number of orders, for example a year or a few years. This way you can make sure you take into account whatever seasonality factor you can have in your sales numbers.
Average Customer Lifespan is an average expected period of time a customer is expected to keep ordering your products. It is something that is difficult to measure precisely, but here is a good way to estimate it:
![]()
Make sure you use the same time unit (a month, a quarter) with all your calculations - for the Churn rate, and for the Average number of orders.
How to increase Customer Lifetime Value
Customer Lifetime Value is one of the integral metrics of your eCommerce business performance. To increase it, there are several areas you may to look into:
- Increasing Average Order Value by creating cross-selling, upselling and incentives for customers to spent more on each order
- Increase Number of Orders each customer make: loyalty programs, time-bound offers, efficient communications about new products are some of the methods to do this
- Increase the average lifespan of the customer. Do this by decreasing churn - identify and solve pain points before they cause customers to opt out of using your product.
These are the top 6 eCommerce metrics that will give you a comprehensive picture of what is going on in your eCommerce business. In this post we only had a general overview of each of the metrics, while in-depth discussion can allow for the whole article dedicated to each of them.
The list of useful metrics does not end here: there are quite a few more, from return rate to net promoter score that will allow you to have a glance at the various aspects of your enterprise. More articles are certainly to come to talk about them, and we sincerely hope you’ll stay tuned to read them too.
Meanwhile, if you would like to discuss how use of these metrics can improve business – we will be happy to be a part of that discussion. Feel free to reach out using the “Contact Us” form on our website.